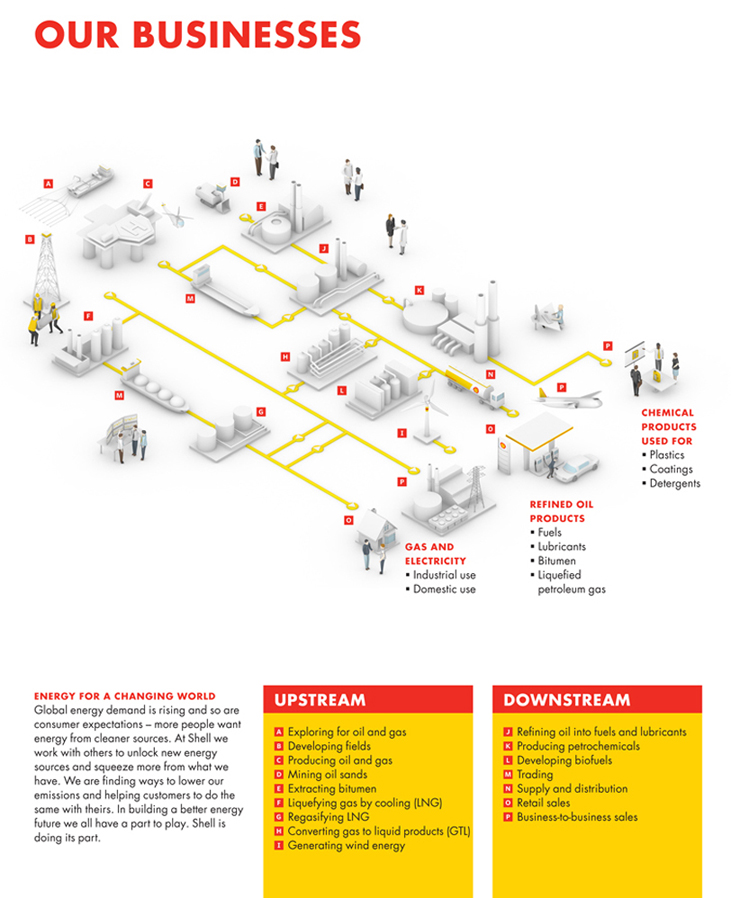
Energy companies are difficult to run(heavy regulation, political risk, uncertainty, natural resources constraint), and even harder to value(due to real options, volatility and cyclical nature). Recognizing this cyclical nature, and their heavy dependence on oil, leading energy companies have diversified downstream into petrochemicals, energy etc. This makes the task of investors even harder. So when a company simplifies this task, it is to be commended, not least because(hopefully), other companies can attempt a similar depiction next year. Below is how Shell depicts its businesses. At first glance, some features are clear
- Suitably chosen pics(like gas station) depicts nature of operations
- Process flow like approach gives an idea of linkages
- And lastly, the 3D diagram used is just amazing to give a 'birds eye view' of the organisation.
The independent directors and investors of Shell are quite lucky for such an user friendly reporting. For those interested in the whole document, you can get it
here on the SEC website.
No comments:
Post a Comment